Performance Based Planning and Programming
Overview
Regional transportation planning is being integrated with performance measures! At CRCOG, we are creating targets for federally established performance measures to guide the Capitol Region’s future transportation plans.
This page briefly summarizes the performances measures that FHWA and FTA require to guide future transportation planning. Per federal requirements, State DOT’s must establish initial statewide targets for each measure. The RPO – often designated as a Metropolitan Planning Organization (MPO) in a large urbanized region then has 180 days to either support the state DOT’s target, or independently establish its own targets for any of the measures within the MPO. These performance measures must be regularly monitored and reported with new targets typically set in 2 or 4 year time frames.
Legislation and Requirements
MAP-21 and the FAST Act legislation required USDOT to establish transportation performance measures, and required States and Regions to set performance targets for those measures. There are five groupings of performance measures: three groupings mandated by the Federal Highway Administration (FHWA) and two by the Federal Transit Administration (FTA). The three FHWA measure groupings are Safety, Bridges & Pavement, and System Performance. The two FTA measure groupings are Transportation Asset Management (TAM) and Transit Safety. They are required of both state departments of transportation and metropolitan planning organizations, which will work together towards meeting these targets. If state DOT’s and MPO’s do not comply, federal funding for state and local transportation projects may be affected. The regulatory basis of the performance measures can be found in Chapter 23 of the Code of Federal Regulations Part 490 (23 CFR Part 490).
Federal Regulations
State Targets for 2024:
- 270 or less – Number of Fatalities
- 0.85 or less – Fatality rate (per 100 million vehicle miles traveled)
- 1,300 or less – Number of serious injuries
- 4.30 or less – Serious injury rate (per 100 million vehicle miles traveled)
- 280 or less – Number of non-motorized fatalities and non-motorized serious injuries
CTDOT 2024 Safety Performance Targets
Pavement Condition
- Federal Regulations – Subpart C of Chapter 23 CFR Part 490
- Click for Fact Sheet
- CTDOT 2024 Targets
- Percentage of pavements on the Interstate System in Good condition: Current Condition – 68.6%, Target – 70.0%
- Percentage of pavements on the Interstate System in Poor condition: Current Condition – 0.2%, Target – 1.3%
- Percentage of pavements on the non-Interstate NHS in Good condition: Current Condition – 37.9%, Target – 35.0%
- Percentage of pavements on the non-Interstate NHS in Poor condition: Current Condition – 1.8%, Target – 3.5%
Bridge Condition
- Federal Regulations – Subpart D of Chapter 23 CFR Part 490
- Click for Fact Sheet
- CTDOT 2024 Targets
- Percentage NHS bridges classified as in Good condition: Current Condition – 14.1%, Target – 14.5%
- Percentage NHS bridges classified as in Poor condition: Current Condition – 7.7%, Target – 6.0%
Freight Movement on Interstate System (IS)
- Federal Regulations – Subpart F of Chapter 23 CFR Part 490
- Click for Fact Sheet
- CTDOT 2024 Targets
- Truck Travel Time Reliability (TTTR) Index = 95th / 50th perc. (The higher the ratio, the worse the reliability): State Current Condition – 1.56, Target – 2.02
Congestion Reduction
- Federal Regulations – Subpart H of Chapter 23 CFR Part 490
- Click for Fact Sheet
- CTDOT 2024 Targets
- Annual hours of peak-hour excessive delay per capita: CRCOG Current Condition – 5.70, Target – 9.80
- Percent of non-single occupancy vehicle (SOV) travel: CRCOG Current Condition – 22.10%, Target – 19.80%
Environmental Sustainability
- Federal Regulations – Subpart G of Chapter 23 CFR Part 490
- Click for Fact Sheet
- CTDOT Initial Targets (2-yr, 4-yr)
- Total Emissions Reduction – Click here to view
- CTDOT 2024 Targets
- Regionwide reduction in kg/day for
- VOC – 87.346
- NOx – 81.978
- PM2.5 – 6.290
- PM10 – 0.000
- CO – 0.000
- Regionwide reduction in kg/day for
- Federal Regulations – 49 CFR Parts 625 and 630
- Click for Fact Sheet
- CTDOT’s 2022-2025 Public Transportation Asset Management Plan (Tier 1)
- CTDOT’s 2022-2025 Public Transit Group Plan (Tier 2)
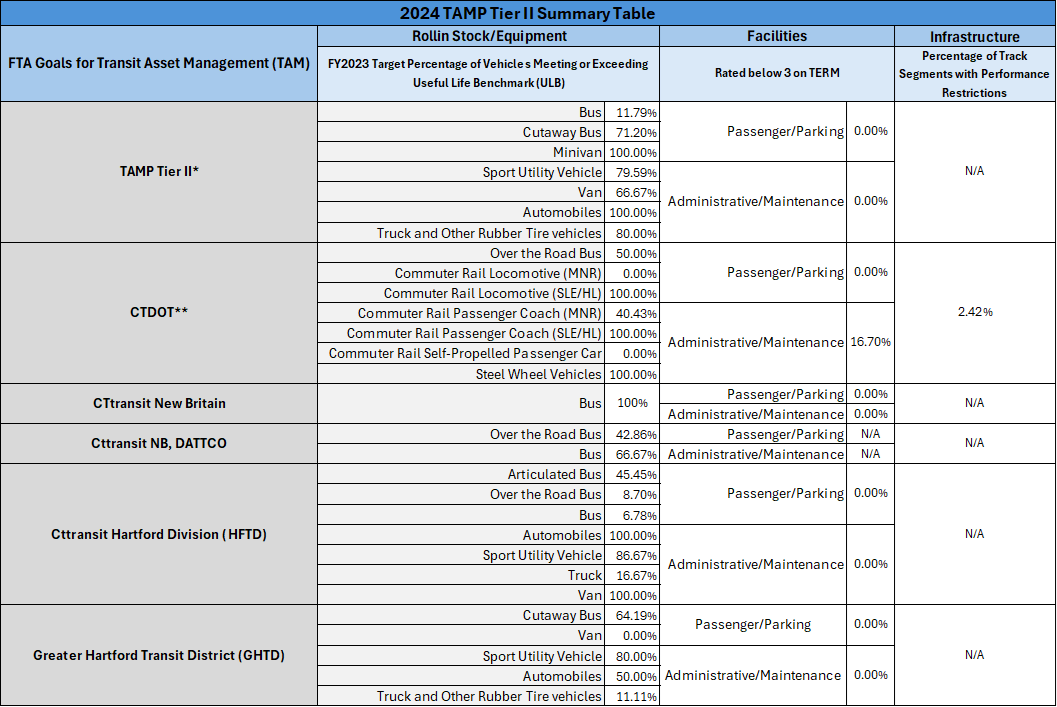
Transit Asset Management Measures
- Components of Measure
- Percentage of vehicles (by type) that meet or exceed the Useful Life Benchmark (ULB)
- Percentage of facilities falling below a 3.0 on the Transit Economic Requirement Model (TERM) scale
See table below for targets for each of the six providers in CRCOG’s area:
Federal Transit Administration (FTA) Information
Fatalities
- Components of Measure
- Total number of reportable fatalities and rate per total vehicle revenue miles by mode
Injuries
- Components of Measure
- Total number of reportable injuries and rate per total vehicle revenue miles by mode
Safety Events
- Components of Measure
- Total number of reportable events and rate per total vehicle revenue miles by mode
System Reliability
- Components of Measure
- Mean distance between major mechanical failures by mode.
Transit Provider PTASP Targets
2024 Transit Safety Measures Summary Table